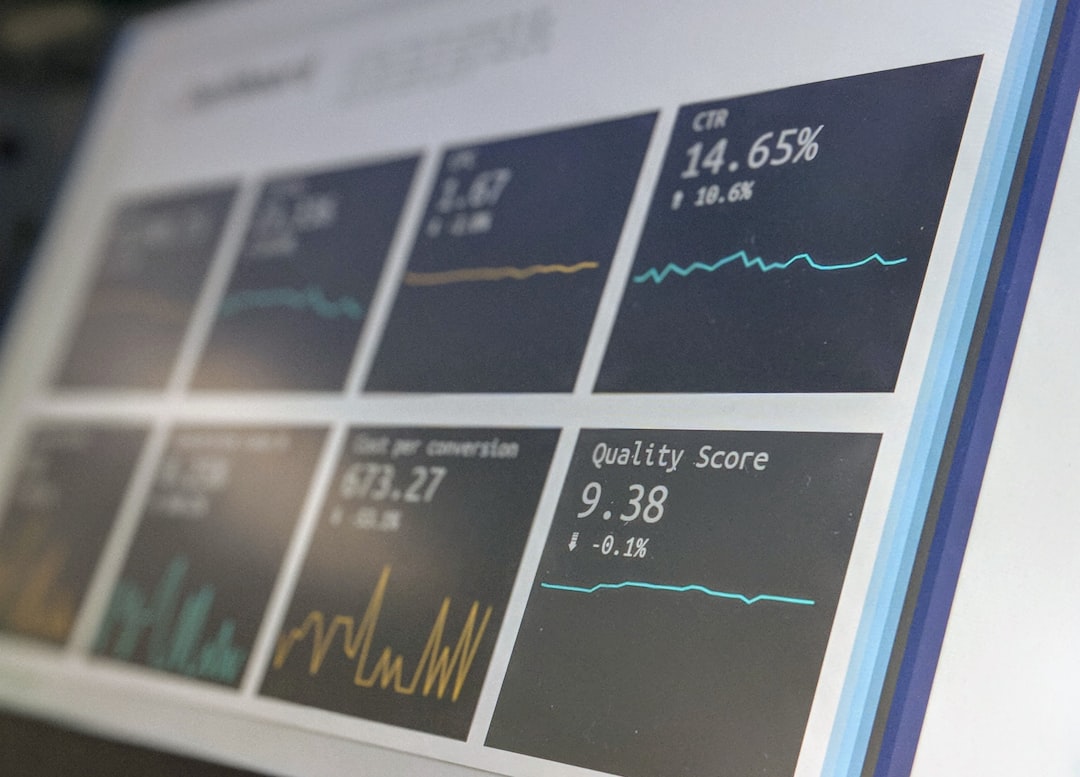
Understanding Economic Reports: A Guide to Interpretation
# Introduction. Interpreting economic reports can often feel like trying to decipher a foreign language, especially for those who are not economists or financial analysts. Economic reports provide crucial information about the overall health of the economy and can impact various sectors including business, finance, and governmental policy-making. This blog post aims to demystify economic reports, offering readers insights into their significance and how to interpret them effectively. # Types of Economic Reports. There is a diverse range of economic reports, each serving a different purpose. The most common types include GDP reports, employment statistics, inflation reports, and consumer confidence indexes. ## GDP Reports. Gross Domestic Product (GDP) is one of the primary indicators of economic performance. It measures the total value of goods and services produced over a specific time period. Understanding how GDP is calculated and the difference between nominal and real GDP is essential. Should GDP rise, it often signals economic growth, while a decline may indicate recession. ## Employment Statistics. Employment reports are crucial for gauging the job market's health. These reports typically include data about unemployment rates, job creation, and wage growth. A low unemployment rate generally indicates a robust economy, while rising unemployment can signal economic struggles. ## Inflation Reports. Inflation measures the rate at which the general level of prices for goods and services rises, eroding purchasing power. The Consumer Price Index (CPI) and the Producer Price Index (PPI) are key metrics in understanding inflation. Monitoring inflation trends can help individuals and businesses make informed financial decisions. ## Consumer Confidence Index (CCI). This index gauges the confidence consumers have in the economic performance, impacting their spending habits. High consumer confidence often leads to increased spending, which drives economic growth, while low confidence can inhibit it. # Key Metrics and Indicators. When analyzing economic reports, it’s important to focus on key metrics and indicators that provide deeper insights. ## Growth Rates. Growth rates tell you how fast an economy is expanding or contracting. For instance, quarterly growth rates can reveal trends in economic performance that aren’t obvious in annual reports. ## Year-over-Year Comparisons. Understanding changes over a year can highlight broader economic trends. For instance, comparing daily stock activity can show investors whether the market is typically bullish or bearish. # Economic Context and Trends. Interpreting these reports in a vacuum is a mistake. Economic reports should always be viewed in context. Understanding the political environment, global events, and other factors that could impact economic data can provide a more nuanced interpretation. ## Global Factors. International trade agreements, conflict, and global economic conditions play a substantial role in domestic economies. For instance, a report on rising oil prices due to geopolitics can immediately affect inflation rates in local economies, influencing governmental and consumer responses. # Importance of Timeliness. Economic data can be subject to revisions, so it’s essential to remain updated with the most current reports. Delayed responses to outdated data can lead businesses to make poor financial decisions. # Conclusion. Understanding how to interpret economic reports is crucial for making informed decisions, whether you’re an investor, a business owner, or a consumer. As you familiarize yourself with the types of reports and key indicators, coupled with timely and contextual data, you will develop the skills necessary to analyze economic health accurately. In a world increasingly guided by data, equipping yourself with these interpretative skills is invaluable. .


