08 Dec
Back

How to Write an Economic Analysis: A Comprehensive Guide.

Posted at 08 Nov 2024

7 minute readtime

7 - Introduction

Writing an economic analysis is a vital skill for anyone involved in business, policy-making, or academic research. It involves examining various economic factors, assessing data, and drawing conclusions that can impact future decisions. In this guide, we will delve into the essential steps and techniques necessary for producing a comprehensive economic analysis. Whether you’re a student, a professional, or an entrepreneur, this guide will equip you with the tools to understand economic trends and articulate analysis effectively.

8 - Understanding the Purpose of Economic Analysis

Economic analysis serves multiple purposes. It helps in understanding how various factors influence economic conditions, including employment rates, production levels, and consumption patterns. The goal is to provide insights that can guide decision-making for businesses, governments, and non-profit organizations. Before diving into the process, it’s important to identify the specific purpose of your analysis, whether it’s to evaluate a policy, compare economic indicators, or forecast potential future trends. Understanding your aim will guide your research and the structure of your analysis.

9 - Gathering Relevant Data and Information

The foundation of any strong economic analysis is credible and relevant data. Utilizing both primary and secondary data sources is crucial. Primary data may include surveys, interviews, and new data collected through research, while secondary data can be obtained from government reports, academic studies, and existing literature. It's essential to ensure that your data sources are credible to maintain the integrity of your analysis. Additionally, familiarize yourself with the most recent economic indicators, such as GDP growth rates, inflation rates, and unemployment rates, as they provide context for regional and global economic conditions.

10 - Analyzing Economic Indicators and Trends

Once you’ve gathered your data, the next step is analysis. Here, you'll want to apply various statistical methods and economic theories to the data. This involves looking at trends over time and identifying relationships between different economic variables. For instance, how does an increase in interest rates affect consumer spending? Utilizing tools such as regression analysis, moving averages, and econometric modeling can aid you in this process, allowing for more comprehensive insights. Analytical skills are imperative, as they enable you to draw logical conclusions backed by data.

11 - Structuring the Analysis

The structure of your economic analysis is crucial for clarity and coherence. A typical economic analysis report may include the following sections:

1 - Executive Summary

- A brief overview of the findings and conclusion.

2 - Introduction

- Outline the purpose and significance of the analysis.

3 - Data Analysis

- Present the data collected and any notable trends.

4 - Discussion

- Interpret the findings, discussing implications and connecting them to broader economic theories.

5 - Conclusion

- Summarize the analysis and offer recommendations if applicable.

6 - References

- Cite all the sources used in your analysis. Each section should logically flow into the next, building a comprehensive narrative.

12 - Writing Clearly and Concisely

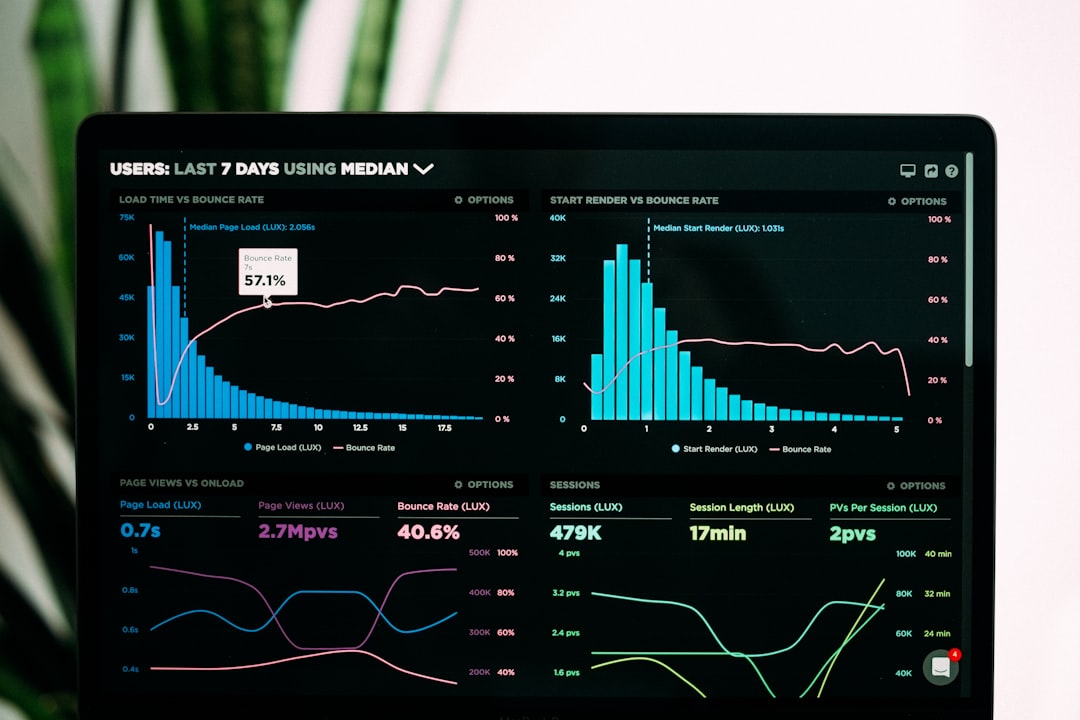
The writing style is paramount in an economic analysis. It should be clear and concise, as complex economic terminology can easily muddle the findings. Always remember your target audience when writing. Use simple language to explain intricate concepts, and incorporate graphs and charts to visually represent data when relevant. These visual aids can provide immediate understanding and keep readers engaged in the analysis. Furthermore, avoid jargon unless absolutely necessary, and always define it when used.

13 - Reviewing and Revising the Analysis

After completing the initial draft of your economic analysis, take the time to review and revise. This step is essential in ensuring accuracy and clarity, as it allows for the identification of any errors or unclear sections. Reading the analysis out loud can help you catch awkward phrasing and run-on sentences. Consider seeking feedback from peers or mentors skilled in economics to gain valuable insights that you might overlook. Revisions may clarify findings or enhance the structure and flow of the report.

14 - Conclusion

Writing an economic analysis is both a skill and an art. It requires a precise understanding of economic principles, proficiency in data analysis, and an ability to communicate complex ideas clearly. By identifying your purpose, gathering relevant data, analyzing trends, structuring your findings clearly, and continually revising your analysis, you will develop strong, effective economic analyses that can influence decisions and strategies in various realms.

Understanding these key steps will empower you to contribute meaningfully to discussions about economic policies, market trends, and strategic business decisions, ultimately enhancing your professional and academic development.

Image Description
Photo gallery:
Share this on social
Related posts from Guides
Guides

A Beginner’s Guide to Economic Policy: Understanding the Basics and Impacts

# Introduction. Economic policy is a critical aspect that shapes the financial landscape of a nation. It encompasses various strategies and measures undertaken by government authorities to influence the economy, control inflation, stimulate growth, and ensure a fair distribution of resources. This guide aims to demystify economic policy for beginners, breaking down the types, tools, frameworks, and potential impacts on everyday life. # What is Economic Policy?. At its core, economic policy refers to the actions and strategies employed by governmental bodies to manage economic affairs. This umbrella term includes fiscal policy, monetary policy, and trade policy. Each of these plays a vital role in sustaining economic growth and stability. Understanding these different dimensions is crucial for anyone looking to grasp the dynamics of economic policy. ## Fiscal Policy. Fiscal policy involves governmental spending and tax policies. It is used to influence a nation’s economic performance. Governments use fiscal policy to either stimulate the economy through increased spending or to slow down inflation by cutting expenses and raising taxes. During economic downturns, for example, a government may choose to increase spending on infrastructure projects, thereby creating jobs and boosting consumer confidence. ## Monetary Policy. Monetary policy is managed by a country’s central bank and concerns the regulation of money supply and interest rates. By influencing interest rates, central banks control inflation and stabilize the national currency. Lowering interest rates encourages borrowing and investing, while raising rates is aimed at curbing inflation. Thus, monetary policy is instrumental for adding stability and controlling economic fluctuations. ## Trade Policy. Trade policy consists of the regulations and agreements that govern international trade. This includes tariffs, trade agreements, and restrictions on imports and exports. A government’s trade policy can significantly impact domestic industries, employment rates, and ultimately the economy’s overall health. For instance, high import tariffs may protect local businesses but can also lead to higher prices for consumers and retaliation from trading partners. # The Role of Government in Economic Policy. The government plays a pivotal role in executing economic policy, often influenced by legislative bodies, economic advisors, and public opinion. Policymakers must carefully assess economic indicators, such as employment rates, GDP growth, and inflation, to devise appropriate strategies. Furthermore, economic policy is often a balancing act, where the needs of various stakeholders—businesses, consumers, and workers—must be weighed against one another. # Tools of Economic Policy. Policymakers utilize various tools to implement economic policy effectively. Key tools include - **Regulatory frameworks**: These set rules and standards that guide economic activity. - **Budgeting**: Allocating funds to various sectors based on policy priorities. - **Interest rates**: Adjusting rates to facilitate spending and saving behaviors in the economy. - **Taxes**: Structuring tax codes to encourage or discourage certain economic activities. Each tool has its implications, and the successful application often requires a deep understanding of the complex interactions within the economy. # Impacts of Economic Policy on Individuals. Economic policy does not exist in a vacuum; its ramifications affect citizens daily. For instance, changes in monetary policy can influence household mortgage rates, affecting where families choose to live. Fiscal policy changes, such as tax reforms, can lead to increased disposable income or, conversely, reduced spending power. Understanding these effects can empower individuals to better navigate their economic landscape and advocate for policies that support their interests. # Conclusion. A strong grasp of economic policy is essential for understanding how government decisions impact personal and societal outcomes. As a beginner, recognizing the types, tools, and implications of these policies will not only aid in comprehending current events but also empower individuals to actively participate in discussions about the economic future. While the intricacies of economic policy can seem daunting, a foundational knowledge paves the way for greater engagement and informed decision-making. By staying informed and involved, citizens can significantly influence the direction of economic policy that affects their lives and communities. .

Guides

A Comprehensive Guide to Building Econometric Models.

# Introduction. Econometrics combines economic theory, mathematics, and statistical inference to analyze economic phenomena and make forecasts. Building econometric models is a crucial aspect of this discipline, facilitating the understanding of relationships between various economic variables. This guide aims to equip you with the knowledge needed to effectively construct econometric models, from the theoretical framework to the actual implementation. # Understanding Econometric Models. Econometric models serve as the backbone for empirical research in economics. These models can take various forms, including linear regression, logistic regression, and time-series analysis. The essential goal is to quantify relationships between independent and dependent variables effectively. For example, an econometric model could be used to analyze how changes in interest rates affect consumer spending. The fundamental principle is that economists utilize these models to test hypotheses, validate theories, and make data-driven policy recommendations. Before diving into model building, you need to have a solid grasp of the terminology and underlying concepts that guide econometric modeling. This familiarity includes understanding dependent and independent variables, various types of data (cross-sectional, time-series, and panel data), and the assumptions that underpin statistical models. Clarity on these foundational concepts sets the stage for successful model development and improvement. # Collecting and Preparing Data. The next critical step in building an econometric model involves the collection and preparation of data. High-quality data is paramount, as the results of your econometric model will hinge on the integrity of this data. Sources of data can vary widely, from government publications and public databases to proprietary datasets. Once acquired, data must be cleaned and transformed to ensure it is suitable for analysis. This might involve removing outliers, dealing with missing values, or converting categorical variables into numerical formats. Additionally, you should conduct exploratory data analysis (EDA) to gain insights into the data before formal modeling. Using descriptive statistics and visualization techniques not only aids the cleaning process but also helps in understanding underlying patterns, trends, and potential relationships between variables. EDA can provide invaluable insights into potential correlations and causations, which can guide subsequent modeling decisions. # Choosing the Right Model Specification. After preparing your data, the next step involves choosing the appropriate model specification. Model specification refers to the functional form chosen to express the relationship between the dependent variable and independent variables. Choosing a model incorrectly can lead to biased or inefficient estimates. Various models have their pros and cons; therefore, understanding your data's characteristics is key. For instance, if your dependent variable is binary, a logistic regression may be more appropriate than linear regression. Moreover, performing a robustness check during this phase is crucial. This involves estimating different models and comparing their performance using metrics such as R-squared, adjusted R-squared, and Akaike Information Criterion (AIC). This process aids in identifying the model that best fits your data and provides the most reliable insights without overwhelming complexity. # Estimation and Hypothesis Testing. Once you have your model specified, the next step is estimation. Using statistical software, you will estimate the model parameters, which involves the application of methods like Ordinary Least Squares (OLS) for linear regression models. Following estimation, hypothesis testing is essential to confirm whether the relationships you've proposed actually hold true in a statistical sense. Key tests include checking the significance of individual coefficients, overall model significance using F-tests, and diagnostic checks for issues such as multicollinearity, autocorrelation, and heteroscedasticity. Addressing these issues ensures the validity of your results and avoids misleading conclusions. If diagnostic tests indicate problems, model adjustments may be necessary. # Interpreting Results and Making Predictions. The final stage of building an econometric model is interpreting your results and making predictions. Proper interpretation not only includes recognizing the sign and magnitude of coefficients but also understanding economic implications. For example, a significant coefficient related to consumer spending per unit change in income can inform policymakers about the effectiveness of fiscal interventions. Predictions made through the econometric model often serve as foundational support for strategic decision-making in both public and private sectors. It is essential to communicate findings effectively to stakeholders who may not possess an econometric background. Visualizations and summary statistics can serve as valuable tools for presenting your conclusions in a digestible format. # Conclusion. Building econometric models is an iterative process that combines theory, data analysis, and statistical testing. The insights and predictions drawn from these models can significantly influence economic policy and business strategies. By following the comprehensive steps outlined in this guide—from understanding econometric principles and preparing data to model estimation and interpretation—you can effectively navigate the complexities of econometric modeling and enhance your analytical capabilities. Building a reliable econometric model requires practice and a continuous feedback loop for improvement. Continuous learning and application of new techniques will ensure your models not only provide accurate predictions but also contribute constructively to economic discussions and decisions. .

Guides

Decoding Macroeconomic Indicators: A Comprehensive Guide to Interpreting Economic Data.

## Introduction. In today’s globalized society, understanding macroeconomic data is essential for anyone seeking to navigate the complex world of finance and economics. Macroeconomic indicators such as Gross Domestic Product (GDP), unemployment rates, inflation rates, and interest rates provide insights into a country’s economic performance. However, these numbers can be cryptic. This guide aims to demystify macroeconomic data, helping you interpret these indicators accurately and use them to make informed decisions. ## The Importance of Macroeconomic Data. Macroeconomic data acts as a barometer for assessing a nation’s economic health. Investors, policymakers, and businesses rely heavily on these statistics to formulate strategies. By interpreting this data, one can anticipate trends that may impact investments, adjust business plans, or even inform personal financial decisions. Understanding the context around different indicators and how they interact with each other is crucial. ## Key Macroeconomic Indicators and Their Meanings. 1. **Gross Domestic Product (GDP)**: GDP measures the total value of all goods and services produced over a specific time frame. A rising GDP generally indicates a healthy economy; however, it is essential to consider whether the growth is sustainable. A sudden increase may also signal inflation. 2. **Unemployment Rate**: This indicator reflects the percentage of the labor force that is jobless and actively seeking employment. A low unemployment rate usually suggests economic growth, but if it’s too low, it could indicate an overheated economy. 3. **Inflation Rate**: Inflation measures the rate at which the general level of prices for goods and services rises, eroding purchasing power. Hyperinflation can be damaging while deflation may indicate an economic slowdown. Understanding the causes of inflation, including demand-pull and cost-push factors, is vital for proper interpretation. 4. **Interest Rates**: Set by central banks, interest rates are crucial for controlling inflation and influencing consumer behavior. Lower interest rates make borrowing cheaper, stimulating spending, whereas higher rates can do the opposite. The interplay between interest rates and investment is essential for economic forecasting. ## Relationships Between Different Indicators. Interpreting macroeconomic data often requires understanding the relationships between various indicators. For instance, a rise in the unemployment rate may lead to lower consumer spending, which could result in a decrease in GDP. Similarly, increasing interest rates typically signal that inflation is becoming a concern, often leading to a period of economic contraction. By looking at these interconnected indicators, one can formulate a more comprehensive view of the economy. ## Utilizing Reports and Data Sources Effectively. To interpret macroeconomic data accurately, it’s critical to consult reliable sources. Institutions like the International Monetary Fund (IMF), World Bank, U.S. Bureau of Economic Analysis (BEA), and the Federal Reserve provide data and reports that are invaluable. When analyzing data, pay attention to not just the figures themselves but also the methodology used for collection. Understanding the source of your data can provide insights into its reliability and context. ## The Impact of Current Events on Economic Data. Events such as political changes, natural disasters, and global financial crises can dramatically alter economic indicators. For example, the COVID-19 pandemic led to unprecedented swings in unemployment and GDP, affecting global supply chains and consumer behavior. Keeping abreast of current events enables you to more accurately interpret the data and understand its relevance in a changing landscape. ## Conclusion. Interpreting macroeconomic data is not just about understanding numbers; it is about understanding the broader implications for society and the economy. By familiarizing oneself with key indicators, their relationships, reliable sources, and the impact of current events, anyone can gain insight into economic trends. This knowledge is vital for informed investment decisions, sound business strategies, and an understanding of the world we live in. As we move forward, the ability to decode economic data will continue to be a critical skill for navigating the complexities of today’s financial world. .

Guides

A Comprehensive Guide to Building Econometric Models.

# Introduction. Econometric models are essential tools for analyzing economic data and forecasting future outcomes. Understanding how to construct these models is crucial for economists, analysts, and policymakers. This guide provides a step-by-step approach to building robust econometric models, covering everything from foundational concepts to advanced techniques. # Understanding Econometrics. Econometrics combines statistical methods with economic theory to test hypotheses and forecast future trends. Before diving into model building, it's important to establish a solid understanding of the fundamentals of econometrics, including key concepts such as correlation, causation, and regression analysis. Knowledge of both economic theory and statistical tools will enable you to create models that are not just mathematically sound but also practically relevant. ## Key Concepts to Master. To build effective econometric models, familiarize yourself with several key concepts: - **Dependent and Independent Variables:** Identify which variable is being predicted (dependent) and which variables are used to predict it (independent). - **Regression Analysis:** This statistical method helps in estimating the relationships among variables. Learn about different types of regression analyses such as linear regression, logistic regression, and more. - **Model Specification:** Correctly specifying a model is crucial. This includes choosing the right variables, functional forms, and understanding the assumptions that underpin the econometric model. # Steps to Build an Econometric Model. Building an econometric model involves several critical steps. Below are the primary phases you should follow when developing your model. ## 1. Defining the Objective. Before commencing modeling, clearly define the purpose of the analysis. Are you trying to estimate economic relationships, test a hypothesis, or forecast future values? Understanding the objective will guide all subsequent steps, including variable selection and model formulation. ## 2. Data Collection. The quality of data directly affects the outcome of your econometric model. Collect reliable and relevant data from reputable sources. Economic data can be found through government databases, international organizations, and academic publications. Consider both time-series and cross-sectional data, depending on your model. ## 3. Exploratory Data Analysis (EDA). Conduct exploratory data analysis to understand the characteristics of your dataset. This includes calculating summary statistics, drawing visualizations, and identifying potential outliers or anomalies. EDA will help you to better understand the relationships between the variables and prepare for model fitting. ## 4. Model Specification. Model specification involves selecting the appropriate functional form for your econometric model. You may choose between linear and nonlinear specifications based on your data and research questions. It’s vital to include all relevant variables while avoiding overfitting. ## 5. Estimation of Parameters. Once your model is specified, the next step is estimating the parameters using suitable estimation techniques, such as Ordinary Least Squares (OLS) or Maximum Likelihood Estimation (MLE). Ensure that you evaluate the assumptions of your chosen estimation method before proceeding. # Validating Your Model. After estimation, it’s essential to validate your econometric model. This includes checking for multicollinearity, heteroskedasticity, and autocorrelation in the residuals. Utilize diagnostic tests like the Durbin-Watson test or VIF (Variance Inflation Factor) to ensure the robustness of your model. ## Model Refinement. Based on validation results, refine your model as necessary. This could involve adding or removing variables, altering the functional form, or selecting different estimation techniques to improve predictive power and accuracy. # Conclusion. Building econometric models requires a blend of theoretical knowledge, statistical acumen, and practical experience. By following the steps outlined in this guide, you can enhance your modeling skills and contribute meaningful insights into economic analysis. Remember that econometric modeling is iterative; constant refinement and validation are key to achieving reliable results. Happy modeling! .

Latest on all blogs

-
-

12:01

Top 10 Beaches in the World: The Ultimate Guide to Paradise

Introduction. When it comes to travel, few experiences can rival the joy of sinking your toes into soft, warm sand while gazing upon crystal-clear waters. The world is dotted with breathtaking beaches, each offering its own unique charm and allure.
Image Description

11:00

Modern Design Ideas for Every Space: Elevate Your Interiors.

Introduction. Modern design is characterized by clean lines, minimalism, and functionality while embodying an aesthetic that caters to today’s lifestyle. As we move forward, intertwining contemporary techniques with timeless motifs can elevate any space.
Image Description

10:03

The Role of Technology in Economic Business Growth

Introduction. In today’s fast-paced business environment, technology serves as a crucial driver for economic growth. As businesses adapt to new tools and technologies, they can enhance their productivity, streamline operations, and open new avenues for revenue generation.
Image Description

Ads

-
-

Our office

-
-
Articles in category business
Home Latest Radio Partners