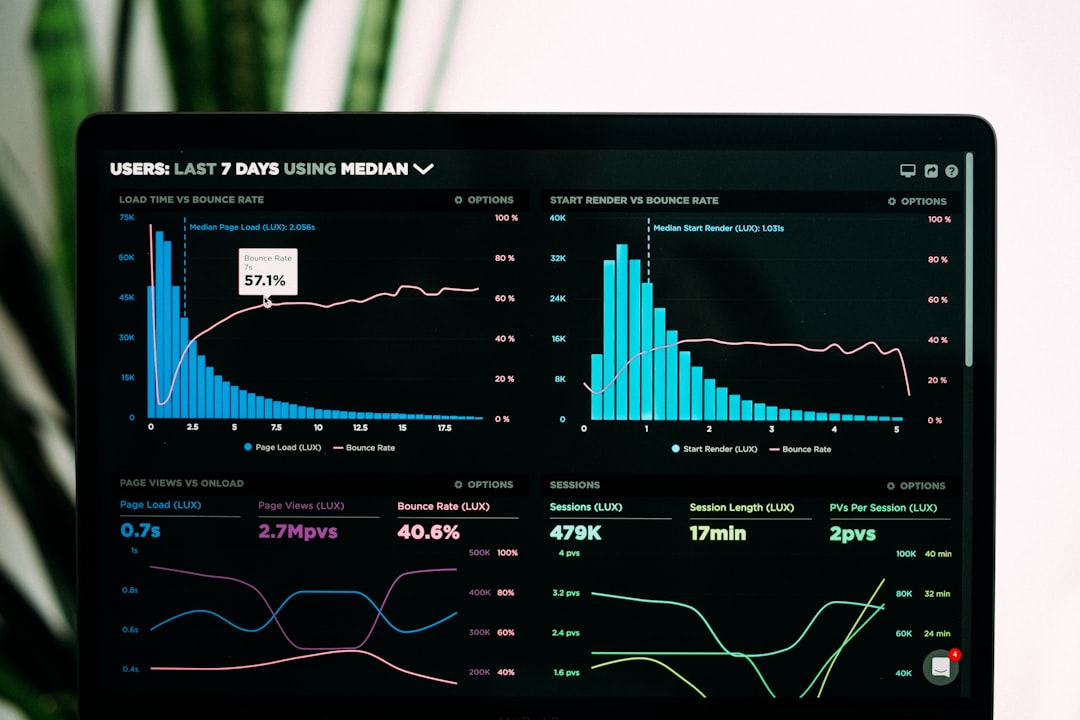
How to Create Economic Forecasts: A Step-by-Step Guide.
# Introduction. Economic forecasting plays a pivotal role in decision-making for businesses, governments, and researchers. It involves predicting future economic conditions based on a combination of historical data and analytical models. Accurate forecasts can provide critical insights that guide investment strategies, policy implementations, and overall business planning. This guide aims to equip you with the essential tools and methodologies to create effective economic forecasts, enhancing your ability to respond to changing market dynamics. # Understanding Economic Indicators. One of the fundamental aspects of creating economic forecasts is understanding the key economic indicators that influence market trends. Common indicators include Gross Domestic Product (GDP), unemployment rates, inflation rates, and consumer confidence indexes. Each of these metrics provides insight into economic performance and can significantly impact business strategies: 1. **Gross Domestic Product (GDP)**: This measures the total value of all goods and services produced within a country. A rising GDP often indicates economic growth, while a declining GDP could signal a recession. 2. **Unemployment Rates**: This reflects the percentage of the labor force that is unemployed and actively seeking employment. High unemployment can lead to decreased consumer spending, negatively affecting overall economic conditions. 3. **Inflation Rates**: This indicates the rate at which the general price level of goods and services is rising. Understanding inflation is essential for predicting purchasing power and cost of living changes. 4. **Consumer Confidence Index (CCI)**: This measures how optimistic or pessimistic consumers are regarding their expected financial situation. High consumer confidence typically leads to increased spending and investment. By tracking these indicators over time, you can identify patterns that may inform future economic conditions. # Collecting Historical Data. Once you have identified the key indicators relevant to your forecasting model, the next step is gathering historical data. This involves collecting both quantitative and qualitative data that pertain to the chosen indicators. Data sources can include governmental economic reports, industry publications, and financial databases: 1. **Government Reports**: National statistical agencies provide data on GDP, inflation, and unemployment rates. This data is often available in public databases, reflecting historical trends over many years. 2. **Industry Reports**: Professional organizations and think tanks often publish reports containing valuable economic statistics and analyses specific to various industries. 3. **Financial Databases**: Services like Bloomberg or Statista are essential for accessing detailed economic data, including stock performance and market analysis. 4. **Surveys and Market Research**: Qualitative data obtained through surveys can yield insights into consumer behavior and expectations, supporting quantitative data analysis. Accurate data collection is crucial for producing reliable forecasts. Ensure that the data you gather is up-to-date, relevant, and from credible sources. # Constructing a Forecasting Model. With your data in hand, you can proceed to construct a forecasting model. There are several methodologies you can adopt, depending on the complexity of your analysis and the timeframes you aim to predict. Some common approaches include: 1. **Time Series Analysis**: This statistical method involves analyzing historical data points to identify trends and cyclic patterns. Techniques like autoregressive integrated moving average (ARIMA) are widely used in time series forecasting. 2. **Causal Models**: These models assume that certain variables influence others. For example, you might explore how consumer confidence affects retail sales. Building regression models can help in identifying these relationships. 3. **Economic Indicators Models**: Using leading, lagging, and coincident indicators can paint a broader picture of economic expectations. For instance, housing starts data might indicate future trends in economic growth. 4. **Qualitative Forecasts**: Sometimes, expert opinions and insights can fill in gaps that data alone cannot. Using focus groups, expert panels, and Delphi surveys can enhance your forecasting by incorporating qualitative insights into quantitative models. The choice of model depends on your specific needs, data availability, and the precision required in your forecasts. Be prepared to iterate and refine your model based on ongoing data collection and analysis. # Validating and Adjusting Your Forecasts. Post modeling, it's essential to validate your forecasts against actual outcomes. This involves comparing your predictions with real economic conditions as they unfold. The validation process includes: 1. **Backtesting**: This method checks how your model's predictions compare to historical data. This will highlight the strengths and weaknesses of your forecasting model. 2. **Sensitivity Analysis**: This process evaluates how different variables affect the outcomes of your forecasts. By altering key assumptions, you can assess the stability of your predictions. 3. **Adjusting Parameters**: Based on validation, adjust your forecasting model by refining inputs and recalibrating for accuracy. This ongoing refinement makes your economic forecasts more robust and reliable over time. 4. **Monitoring Economic Trends**: Keep a close watch on new data releases and changes in economic indicators. Adjust your forecasts as needed to reflect these changes in real-time. # Utilizing Technology in Forecasting. Today's technology has transformed how economic forecasts are created and analyzed. Various software tools and platforms can help streamline data collection, modeling, and analysis processes: 1. **Statistical Software**: Tools like R, Python, and SAS offer extensive libraries and packages for statistical analysis, including time series forecasting and regression modeling. 2. **Business Intelligence Tools**: Platforms such as Tableau and Microsoft Power BI facilitate data visualization, making complex datasets comprehensible and helping to identify trends quickly. 3. **Machine Learning Algorithms**: Advanced analytics employing machine learning can recognize patterns across vast datasets that might be too complex for traditional analysis. 4. **Online Databases and APIs**: Utilize APIs from financial institutions or data services to obtain real-time updates on economic indicators. Leveraging modern technology can enhance the accuracy and efficiency of your forecasting efforts, making it easier to adapt to ever-changing economic landscapes. # Conclusion. Creating effective economic forecasts requires a systematic approach that combines sound data collection, analytical methodologies, and ongoing validation. By understanding essential economic indicators, gathering reliable historical data, and applying advanced modeling techniques, you can produce valuable insights that guide decision-making. Furthermore, the integration of technology and continuous monitoring of emerging trends will empower you to refine your forecasts over time. In an interconnected global economy, harnessing the power of economic forecasting can provide a significant competitive edge for businesses and policymakers alike. .


