09 Mar
Back

Harnessing Big Data: A Comprehensive Guide to Economic Research

Posted at 06 Mar 2025

6 minute readtime

1 - Introduction

In the rapidly evolving world of economics, the integration of big data has transformed the landscape of economic research. The ability to analyze vast amounts of data allows economists to gain insights that were previously unattainable. In this blog post, we will delve into the fundamentals of using big data in economic research, the various tools and methods employed, and the implications it has on decision-making and policy formulation.

2 - Understanding Big Data in Economics

Big data encompasses an extensive range of data sets that are so large and complex that traditional data processing applications cannot handle them effectively. In economic research, big data may include information from online transactions, social media interactions, user behavior on websites, sensor data, and more. The diversified nature of these data sources enriches the analysis, providing a more nuanced understanding of economic phenomena.

3 - Tools and Technologies for Economic Analysis

To harness big data effectively, researchers use a variety of tools and technologies. Popular programming languages like R and Python offer powerful libraries for data analysis and visualization. Additionally, database management systems, such as SQL, and cloud computing platforms, such as Google Cloud or Amazon Web Services, provide the infrastructure necessary to store, manage, and process large data sets. Machine learning techniques are frequently employed to identify patterns and predictions based on the data, making them invaluable in economic forecasting.

4 - Data Sources for Economic Research

The sources of big data for economic research are abundant and varied. Government agencies often publish economic indicators, employment statistics, and market data. Private sector organizations contribute through consumer behavior tracking, purchase histories, and demographic analytics. Furthermore, social media platforms present a wealth of qualitative data that can reflect public sentiment and consumer trends. Understanding where to source this data is crucial for effective economic analysis, and researchers must be adept at navigating both public and private datasets.

5 - Applications of Big Data in Economic Research

The applications of big data in economic research are vast. From macroeconomic forecasting to micro-level consumer behavior analysis, the insights derived from big data can influence both academic theories and practical applications. For instance, economists can predict inflation rates more accurately by analyzing real-time spending data from various demographics. Similarly, assessing the impact of monetary policy initiatives can be refined through large-scale analysis of financial transaction data. Using big data, economists can build more accurate models, which in turn provides better recommendations for policy-making.

6 - Challenges of Using Big Data in Economic Research

Despite the myriad benefits, the use of big data in economic research poses specific challenges. Data privacy and security remain paramount concerns, as researchers must navigate regulations surrounding confidentiality and data protection. Additionally, the sheer volume of data can overwhelm researchers, making it challenging to distill actionable insights. Data quality is also a critical factor, as inaccurate or biased data can lead to misleading conclusions. To overcome these obstacles, economists must maintain rigorous standards in data collection and analysis, ensuring that all findings are grounded in accuracy and integrity.

7 - Future Trends in Big Data and Economic Research

Looking ahead, the intersection of big data and economic research is expected to grow exponentially. Innovations in artificial intelligence and machine learning will enhance data analysis techniques, leading to deeper insights into complex economic behaviors. Moreover, as more data becomes available from emerging technologies, such as IoT devices, the potential for nuanced real-time economic analysis increases significantly. Policymakers will rely more heavily on the insights derived from big data, making it essential for researchers to stay updated with the latest technologies and methodologies.

8 - Conclusion

Big data has revolutionized the field of economic research, providing tools and insights that have redefined the way economists analyze market behaviors and trends. As researchers continue to explore the uncharted territories of big data, they will unearth invaluable information that can shape economic policies and improve decision-making processes. Embracing these methodologies will enable economists to gain a more holistic view of the economy, ultimately leading to more informed strategies for the future.

Image Description
Photo gallery:
Share this on social
Related posts from Guides
Guides

A Beginner’s Guide to Understanding Economic Policy.

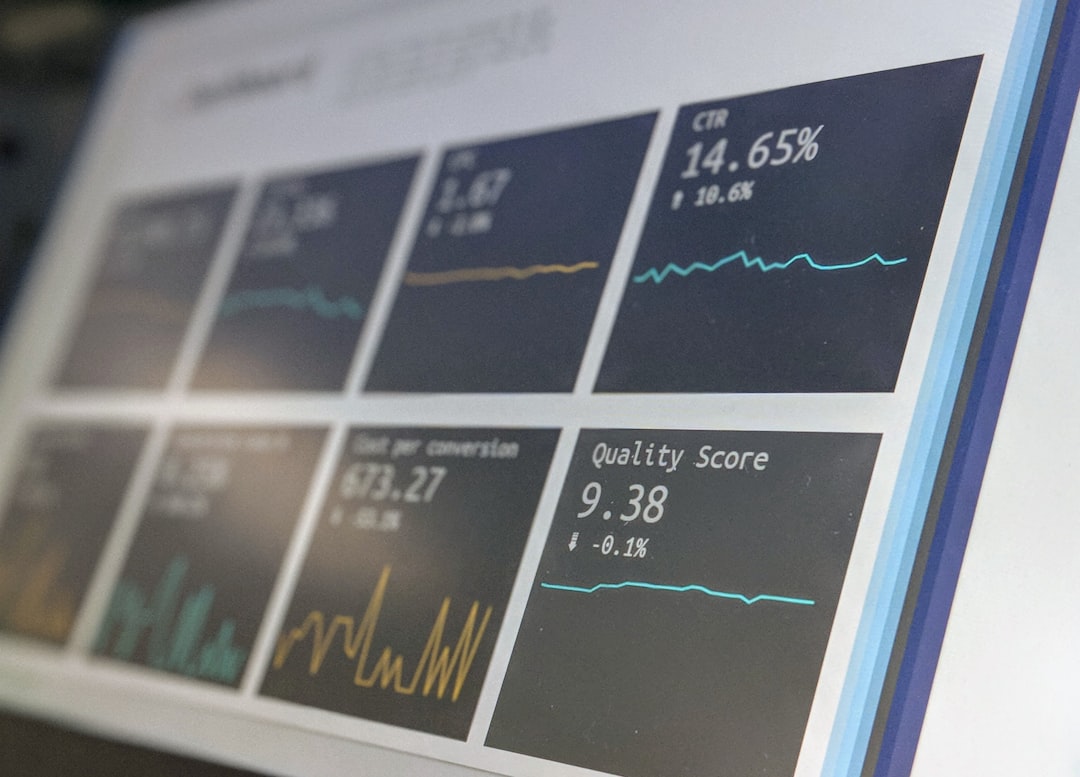
# Introduction. Understanding economic policy is crucial for anyone interested in how governments influence economic activity. Economic policies shape everything from job creation and inflation to international trade and social programs. This guide aims to introduce beginners to the key concepts, types, and impacts of economic policy, providing a solid foundation for further exploration in the field. # What is Economic Policy?. Economic policy refers to the actions that governments take to influence their economies. These can involve fiscal policies, which include government spending and tax strategies, and monetary policies, which concern the management of a country's money supply and interest rates. Simply put, economic policy is how a government attempts to achieve its economic goals, like stable growth, low unemployment, and low inflation. # Types of Economic Policies. Economic policies can be broadly categorized into two main types: fiscal and monetary. Fiscal policy focuses on government spending and taxation. For instance, during a recession, a government may choose to increase public spending or cut taxes to stimulate demand. On the other hand, monetary policy is typically managed by a country's central bank, controlling interest rates and the money supply. This might involve lowering interest rates to encourage borrowing and investing, thus stimulating economic growth. Both fiscal and monetary policies can work hand in hand. For example, during the COVID-19 pandemic, many countries employed a combination of increased government spending (fiscal policy) and reduced interest rates (monetary policy) to help revive their battered economies. # How Economic Policies Affect Citizens. Economic policy has profound effects on citizens' daily lives. Changes in fiscal policy, like tax cuts or increased public spending, can influence individuals' disposable income, ultimately affecting their purchasing power. On a larger scale, effective economic policy can lead to job creation, increased wages, and a higher standard of living. Monetary policy also plays a significant role in daily life. Interest rates affect loans for homes, cars, and education. When interest rates are low, borrowing becomes cheaper, enabling people to invest in homes or businesses. Conversely, when rates rise, borrowing costs increase, potentially slowing down the economy. Thus, understanding how these policies work helps citizens navigate their financial decisions more effectively. # Challenges in Implementing Economic Policy. Implementing economic policy is fraught with challenges. Policymakers must consider a variety of factors, including globalization, technological advancements, and demographic shifts. Each of these factors can significantly influence the effectiveness of a policy. Additionally, the timing of policies is critical; too late, and an economy suffers; too soon, and it may lead to unintended consequences such as inflation. Moreover, political ideologies play a significant role in shaping economic policies. Different parties may have distinct priorities and methods in addressing economic issues, leading to disputes and gridlock. For example, while one party may prioritize tax cuts as a means of stimulating the economy, another may advocate for increased public spending on social programs. # The Role of Data in Economic Policy Making. Data analysis is essential in crafting effective economic policies. Governments rely on economic indicators—such as GDP, unemployment rates, and consumer price index (CPI)—to assess the health of an economy and forecast future trends. Historical data can reveal patterns that help policymakers make informed decisions about which policies might yield the best outcomes. Trend analysis can highlight which demographic groups are benefiting from certain policies and which are not. This is especially important to ensure that economic benefits are broadly shared and that policies do not inadvertently exacerbate inequalities within society. # Conclusion. In conclusion, understanding economic policy is a foundational element of grasping how governmental actions influence the economy at large. Whether through fiscal or monetary means, these policies affect all aspects of life, shaping economic conditions that determine prosperity and growth. By comprehensively analyzing these policies—both their implementation challenges and their effects on citizens—individuals can become informed participants in discussions about the economy and public policy. As the world continues to evolve economically, staying updated on these policies will not only enhance individual knowledge but also bolster civic engagement in decisions affecting economic well-being. .

Guides

How to Analyze Consumer Behavior Data: A Comprehensive Guide

# Introduction. In today’s competitive marketplace, understanding consumer behavior is crucial for any business looking to thrive. Analyzing consumer behavior data enables companies to make informed decisions about product development, marketing strategies, and customer engagement. This guide aims to provide valuable insights into effectively analyzing consumer behavior data. # Understanding Consumer Behavior Data. Before diving into analysis techniques, it's essential to comprehend what consumer behavior data entails. Consumer behavior data encompasses the information collected on how individuals make purchasing decisions, their preferences, and their shopping patterns. This data can be derived from various sources, including surveys, social media interactions, website analytics, and purchase histories. By understanding this data, businesses can discern trends and patterns that are vital for formulating strategies to enhance customer experiences. # Data Collection Methods. Effective analysis begins with robust data collection methods. Below are some common methods used to gather consumer behavior data: 1. **Surveys and Questionnaires**: These are direct methods to collect insights regarding consumer preferences and behaviors. Online tools like Google Forms or SurveyMonkey make it easier to distribute surveys to a broader audience. 2. **Website Analytics**: Tools like Google Analytics track visitor interaction on websites, providing valuable information about page views, time spent, and user demographics. 3. **Social Media Monitoring**: Analyzing engagement on social media platforms offers insights into consumer sentiments and trends relevant to your brand or products. 4. **Purchase History**: Understanding consumers’ past buying habits allows businesses to predict future behavior and tailor marketing efforts accordingly. By utilizing a combination of these data collection methods, businesses can achieve a richer dataset that paints a more accurate picture of consumer behavior. # Organizing and Preparing Data for Analysis. Once you've collected data, the next step is organization. Depending on your data source, this may involve: - **Cleaning Data**: Remove duplicate entries, correct inconsistencies, and manage missing data points to ensure accuracy. - **Categorization**: Classify data into actionable segments based on demographics, buying habits, or engagement levels. This aids in identifying specific consumer segments for targeted marketing. - **Data Transformation**: Standardize data formats, create calculated columns, and prepare the dataset for analysis. This is essential for making comparisons. Using software like Excel, R, or Python can enhance your data preparation process, making it more efficient and scalable. # Analytical Techniques to Employ. With organized data in hand, various analytical techniques can be employed: 1. **Descriptive Analysis**: This technique summarizes data characteristics, providing insights into overall trends and averages—ideal for understanding customer demographics. 2. **Predictive Analysis**: By employing statistical algorithms and machine learning techniques, businesses can predict future consumer behavior based on historical data. This analysis helps in inventory management and marketing forecasting. 3. **Segmentation Analysis**: This involves dividing your consumer base into segments based on shared characteristics. This targeted approach ensures that marketing strategies are more effective. 4. **Sentiment Analysis**: Especially useful for social media and customer reviews, sentiment analysis can assess the emotional tone behind consumer interactions, offering insights into brand perception. # Using Data Visualization Tools. Data visualization plays a pivotal role in data analysis. By using tools like Tableau, Power BI, or even Google Data Studio, you can create visual representations of your data, making it accessible and comprehensible. Visualization helps showcase trends, highlight specific data points, and illustrates findings clearly to stakeholders, allowing them to make data-driven decisions swiftly. # Applying Insights to Business Strategy. The ultimate aim of analyzing consumer behavior data is to leverage these insights to inform business strategies. Utilize the findings to: - **Enhance Product Development**: Fine-tune products based on consumer preferences and feedback. - **Refine Marketing Strategies**: Target specific demographics with tailored campaigns that resonate with their interests and needs. - **Improve Customer Experience**: Identify pain points in the customer journey and address them promptly, fostering loyalty and retention. By applying data-driven insights in these areas, your business can create a more customer-centric approach that leads to sustainable growth. # Conclusion. Analyzing consumer behavior data doesn't have to be daunting. By understanding what data is relevant, collecting it efficiently, organizing and analyzing it properly, and applying insights strategically, businesses can significantly enhance their decision-making processes. Ultimately, understanding consumer behavior data equips businesses to not only meet the needs of their customers but also anticipate them, leading to increased customer satisfaction and loyalty. Incorporating these practices will enable businesses to run effectively in a data-driven world where consumer preferences are constantly evolving. .

Guides

A Comprehensive Guide to Building Econometric Models.

# Introduction. Econometric models are instrumental in interpreting economic data, providing insights and forecasts based on economic theory and statistical methods. As businesses and governments increasingly rely on data-driven decision-making, understanding how to build an effective econometric model becomes essential. ## Understanding Econometrics. At its core, econometrics combines economic theory, mathematics, and statistical techniques to analyze economic data. By quantifying relationships between variables, econometrics helps economists test hypotheses and evaluate economic policies. Econometric models can be simple linear regressions or sophisticated systems that include multiple dependent variables. Given the vastness of data now available, developing robust econometric models has become even more critical in fields including finance, marketing, and public policy. ## Steps to Building an Econometric Model. Building an econometric model involves several steps: 1. **Define the Economic Theory**: Start with a strong understanding of the economic concepts at play. What relationships are you trying to explore or quantify? Clear theories will guide your variable selection and model design. 2. **Data Collection**: Collect relevant data reflecting your identified variables or economic scenarios. Sources may include government databases, financial institutions, and market research. Make sure the data is clean, reliable, and pertinent to your research question. 3. **Variable Selection**: Choose dependent and independent variables wisely. The dependent variable is the one you want to explain or predict, while the independent variables are those believed to influence it. Be cautious about multicollinearity (when independent variables are highly correlated), as it can affect the reliability of your model. 4. **Model Specification**: Specify your model by determining its structure—linear, non-linear, time series, panel data, etc. The specified model should align with economic theory and the nature of the relationships among the variables. 5. **Estimation of Parameters**: Using statistical software tools, estimate the parameters of the model using techniques like Ordinary Least Squares (OLS) or Maximum Likelihood Estimation (MLE). The aim is to find the best-fitting line that represents the relationship between the variables. 6. **Model Validation**: After estimating the model, validate its performance by applying statistical tests. Check for goodness-of-fit (using R-squared), examine residuals for autocorrelation, and employ tests like the Durbin-Watson statistic. Ensure the model is robust and accurately describes the relationships. 7. **Interpretation**: Once validated, interpret the coefficients. What do they tell you about the economic relationships? For instance, if you're analyzing price elasticity, a coefficient of -1.5 for price indicates a 1% increase in price would lead to a 1.5% decrease in quantity demanded. 8. **Policy Implications**: Finally, consider the implications of your findings. How can the results inform economic policy, business strategies, or investment decisions? Communicating these insights effectively is as critical as building the model itself. ## Common Challenges in Building Econometric Models. Several challenges may arise when building econometric models. One common issue is data availability. High-quality, relevant data can be hard to find. Additionally, multicollinearity can undermine the reliability of your estimates. Model overfitting is another risk; complex models may perform well on training data but poorly on new data. It is crucial to maintain a balance between complexity and interpretability. ## Conclusion. Constructing an econometric model requires a harmonious blend of economic theory, statistical analysis, and data interpretation. By following a systematic approach—from defining the economic question to validating the model—you can develop robust models that provide critical insights into economic phenomena. Continuous learning and adapting to new data and methods will enhance your skills in building econometric models, making you equipped to handle the dynamic landscape of modern economies. This guide serves as a foundational framework for anyone venturing into the field of econometrics. The journey of learning and applying econometric methods is both challenging and rewarding—contribute to the broader understanding of economic dynamics and decision-making. .

Guides

How to Use Geographic Information Systems (GIS) in Economics: A Comprehensive Guide.

# Introduction. Geographic Information Systems (GIS) are powerful tools that integrate hardware, software, and data to capture, manage, analyze, and visualize spatial information. In the field of economics, GIS provides essential insights into geographical patterns and relationships that can influence economic trends and policies. This guide explores how to utilize GIS in various economic contexts, from market analysis to urban planning. # Understanding GIS Technology in Economics. GIS technology has evolved significantly over the years. At its core, GIS allows for the mapping of various data sets over geographic locations. For economists, understanding the spatial distribution of resources, population demographics, and economic activity can provide critical insights. One of the primary functions of GIS in economics is to visualize data. For instance, creating heat maps showing population density alongside income levels can reveal patterns in economic inequality. Moreover, GIS can highlight regions where resources are scarce or abundant, facilitating targeted economic development initiatives. # Market Analysis Using GIS. Market analysis is a vital aspect of economics, particularly for businesses looking to enter new markets or expand their services. With GIS, businesses can overlay consumer demographic data on maps to identify potential markets. For example, a retail company might utilize GIS to visualize the distribution of their potential customers based on demographic factors such as age, income, or shopping preferences. By analyzing these factors spatially, they can determine ideal locations for new stores, optimize supply chains, and tailor marketing strategies to specific regions. # Economic Policy Making and Planning. Economic policy makers increasingly rely on GIS to inform decisions that affect urban and regional development. By analyzing spatial data, they can identify areas that require urgent investments or interventions. For instance, GIS can help in understanding patterns of unemployment across different neighborhoods, guiding policies that promote equitable job creation. Moreover, urban planners can utilize GIS to evaluate the economic impacts of new infrastructure projects. By assessing the geographical implications of new roads or public transportation systems on local economies, they can ensure that development is sustainable and beneficial for the community. This application also extends to evaluating environmental impacts, incorporating economic considerations into land use planning. # Environmental Economics and GIS Integration. Environmental economics concerns itself with the relationship between economic activity and the environment. GIS plays an essential role in this field by providing spatial data that can influence policy and investment decisions. For instance, GIS can be used to assess the economic impacts of environmental policies such as carbon taxes or pollution regulations. By modeling the geographical distribution of emissions alongside economic activity, economists can predict the potential economic outcomes of regulatory changes. This integration allows for the development of more effective and targeted environmental policies that consider both economic impacts and environmental sustainability. # The Future of GIS in Economic Analysis. As technology continues to advance, the possibilities for GIS in economic analysis are boundless. With the rise of big data and machine learning, GIS can integrate vast amounts of information from various sources for more nuanced economic analyses. New tools, such as real-time data integration and mobile GIS applications, are improving the efficiency of data collection and analysis, making GIS an even more valuable asset in economics. These innovations pave the way for more dynamic and responsive economic policies that can adapt to changing circumstances. # Conclusion. In conclusion, Geographic Information Systems are invaluable tools for economists, providing insights that are crucial for effective decision-making in various economic contexts. Whether analyzing market potential, informing policy creation, or assessing environmental impacts, GIS offers a spatial perspective that enhances our understanding of economic phenomena. As technology continues to evolve, the integration of GIS with economic analysis will undoubtedly become more sophisticated, leading to more informed and effective economic strategies. .

Latest on all blogs

-
-

00:03

Cultural Highlights to Embrace During Your Travels

Introduction. Travel is more than just visiting new places; it’s about absorbing and appreciating the diverse cultures that define those locations. Cultural highlights enrich your travel experience, offering deep insights into the traditions, history, and social fabric of a place.
Image Description

22:01

Exploring the Wonders: Must-Visit Places in Europe.

Introduction. Europe is a continent rich in history, culture, and breathtaking landscapes. Its diverse geography and vibrant cities make it an ideal destination for every type of traveler.
Image Description

20:02

Essential Travel Tips for Budget Travelers.

Introduction. Traveling doesn't have to break the bank. In fact, with the right approach and planning, you can explore the world on a budget while still having an enriching experience.
Image Description

Ads

-
-

Our office

-
-
Articles in category business
Home Latest Radio Partners