19 Sep
Back

A Comprehensive Guide to Understanding Market Indicators

Posted at 14 Sep 2024

6 minute readtime

1 - Introduction

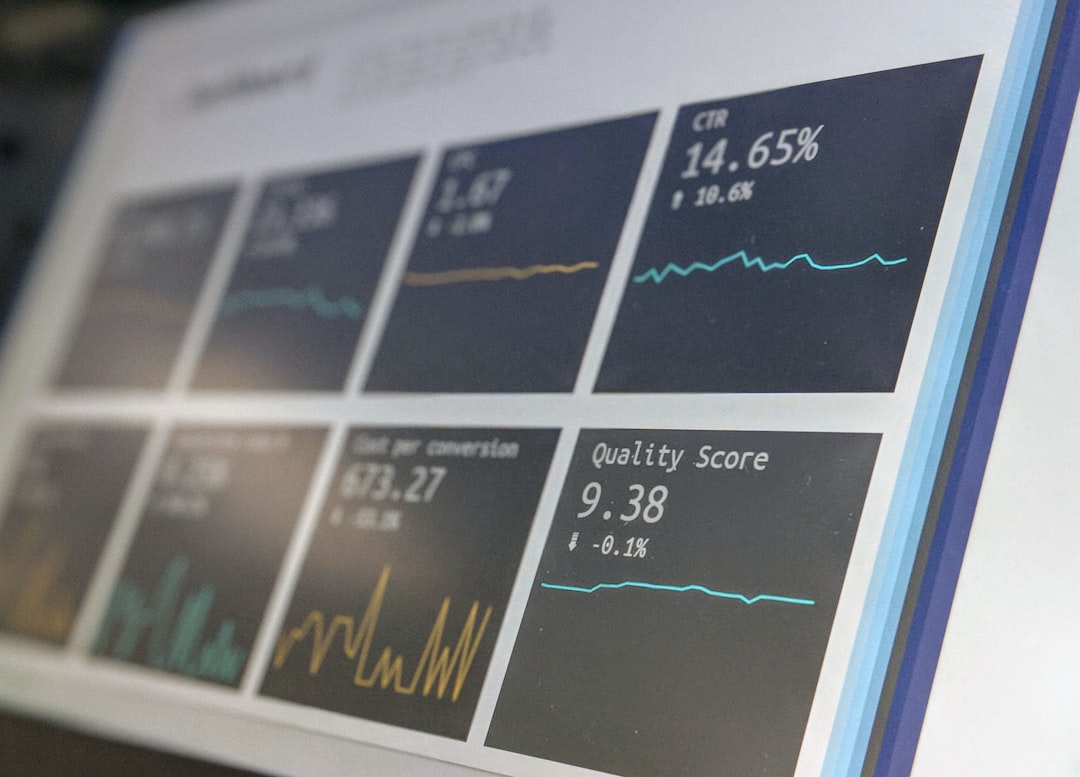
Understanding market indicators is essential for investors and individuals interested in the financial markets. Market indicators provide insights into the overall health of the economy, market trends, and potential investment opportunities. This guide aims to demystify common market indicators and explain how they can inform your investment decisions.

2 - What Are Market Indicators?

Market indicators are statistical metrics used by traders and analysts to interpret market conditions. These metrics can be crafted from various data sources, such as pricing data, volume of trades, and trends over time. They serve as tools for predicting future price movements and gauging market sentiment. A comprehensive understanding of these indicators allows investors to make informed decisions and adjust their strategies accordingly.

3 - Types of Market Indicators

Market indicators can be broadly categorized into three types: leading, lagging, and coincident indicators. Leading indicators signal future movements and help investors predict potential changes in market conditions. Examples include stock market performance, new housing starts, and manufacturing activity. Lagging indicators, on the other hand, reflect past market behavior, such as Gross Domestic Product (GDP), unemployment ratings, and corporate profits. Coincident indicators move in tandem with the economy, providing data on current conditions like retail sales and industrial production. Each type of indicator serves a different purpose in the analysis of market trends.

4 - Leading Indicators: What to Watch For

Leading indicators are particularly valuable as they provide early warnings about potential changes in the market. For investors, monitoring leading indicators can offer a vital edge. For instance, the Purchasing Managers' Index (PMI) reflects how businesses feel about future orders and production. A rising PMI often indicates expansion in the economy, while a decrease points toward contraction. Another significant leading indicator is the stock market itself, which tends to move ahead of the economy by several months. By paying attention to these indicators, investors can position themselves to take advantage of upcoming market opportunities.

5 - Lagging Indicators: Understanding Past Performance

Lagging indicators are essential for confirming market trends and understanding historical context. Although they don’t predict future performance, they provide insight into the prevailing economic conditions. An example is the unemployment rate, which is released after trends have taken shape. If you find that unemployment has decreased consistently, it often confirms that an economic recovery is underway. Other lagging indicators include inflation rates and corporate earnings reports. Understanding these metrics helps investors comprehend how economic conditions have shaped market performance.

6 - Coincident Indicators: Present Economic Health

Coincident indicators reflect the current state of the economy and are vital for gauging economic health at any given moment. Metrics such as retail sales and personal income provide a snapshot of consumer activity and spending patterns. If retail sales are increasing, it suggests that consumers have confidence in the economy, potentially leading to economic expansion. Coincident indicators are crucial for investors wishing to align their strategies with real-time market conditions.

7 - How to Use Market Indicators in Your Investment Strategy

Knowing how to interpret market indicators can be a powerful tool in formulating your investment strategy. It is vital to look at a combination of indicators to understand market dynamics comprehensively. Avoid relying solely on one type of indicator. For instance, you might combine leading indicators to gauge potential growth with lagging indicators to confirm trends. Moreover, consider the economic environment in which you are investing—understanding how indicators interact with one another provides context and clarity. Keeping abreast of economic reports and regularly updating your knowledge about market indicators will empower you in your investment decisions.

8 - Conclusion

Understanding market indicators is a fundamental aspect of navigating the financial markets. By familiarizing yourself with leading, lagging, and coincident indicators, you can develop a comprehensive view of the economic landscape. This in-depth knowledge allows you to put together a more informed investment strategy that can adapt to changing market conditions, helping you to achieve your financial goals. As markets evolve and new data emerges, staying engaged with these indicators will keep you well-positioned in the investment arena.

Image Description
Photo gallery:
Share this on social
Related posts from Guides
Guides

How to Use Geographic Information Systems (GIS) in Economics: A Comprehensive Guide.

# Introduction. Geographic Information Systems (GIS) have revolutionized the way data analytics is conducted in various fields, including economics. By incorporating spatial data into economic analysis, GIS allows for a more comprehensive understanding of economic trends and patterns. Understanding how to leverage GIS not only enhances traditional economic studies but also supports better decision-making by policymakers and businesses alike. In this guide, we will explore the foundational concepts of GIS, its applications in economics, and the best practices for utilizing GIS effectively. # Understanding Geographic Information Systems (GIS). At its core, GIS is a system designed to capture, store, manipulate, analyze, manage, and present spatial or geographic data. It creates a link between data and maps, making it easier to visualize and interpret complex information. In economic contexts, GIS can provide invaluable insights into demographic trends, market analysis, resource allocation, and even urban planning. GIS operates on various platforms, from simple desktop applications to complex server systems. Key components of GIS include hardware (computers and servers), software (GIS applications), data (demographic and economic data), and procedures (methods of data analysis). The systems allow users to layer different data sets to identify relationships that may not be immediately apparent through traditional analysis. # Applications of GIS in Economics. ## 1. Market Analysis. GIS plays a crucial role in market analysis by helping businesses identify and understand market demographics. By visualizing population density, income levels, and consumer behavior, companies can tailor their services or products to meet local needs effectively. For example, a retailer may use GIS to determine the best location for a new store based on the demographic profiles of a region. Furthermore, GIS can analyze travel patterns, thus assisting businesses in optimizing their supply chain and logistics. For instance, restaurants often employ GIS to assess customer distribution, allowing them to identify high-traffic areas and potential customer bases. ## 2. Urban Planning. Urban planning is another area where GIS significantly impacts economic decision-making. Planners can visualize land use, infrastructure, and transportation networks, aiding in the creation of more efficient and sustainable cities. By layering socio-economic data over geographic maps, urban planners can identify areas that require attention, such as underserved communities needing access to services or public amenities. Additionally, GIS helps organizations manage urban resource allocation better, providing insights into where investments can yield the highest social and economic returns. ## 3. Environmental Economic Assessment. As environmental issues become increasingly pressing, GIS helps in evaluating the economic impacts of environmental changes. Economists use GIS to analyze how pollution, resource extraction, or climate change affects local and regional economies. Mapping environmental data alongside economic indicators allows for a more holistic view of the economic repercussions of environmental changes. This application is particularly relevant in assessing the economic viability of agricultural practices, analyzing land-use changes, or evaluating the impact of natural disasters on local economies. # Best Practices for Using GIS in Economics. To effectively utilize GIS tools in economic analysis, consider the following best practices: - **Data Accuracy**: Always ensure that the data used in GIS is accurate, reliable, and up to date. This is crucial for maintaining the integrity of the analysis. - **Layering Data**: Use multiple data layers to derive meaningful insights. For instance, overlaying economic performance indicators with demographic data enhances the understanding of consumer behavior. - **Clear Visualizations**: Strive for clear and concise visual representations of data. Maps and graphs should communicate complex ideas without overwhelming the audience with information. - **Collaboration**: Engage various stakeholders, including policymakers, business leaders, and community representatives, to gather diverse insights and foster collaboration. # Conclusion. Geographic Information Systems (GIS) represent a powerful tool for economists and businesses. By integrating spatial analysis into economic frameworks, GIS enhances the understanding of complex relationships between geographic locations and economic activities. As technology continues to evolve and more data becomes available, the importance of GIS in economic analyses will only increase, paving the way for smarter, data-driven decision-making. Whether for market analysis, urban planning, or environmental assessments, mastering GIS tools will undoubtedly provide a competitive edge in understanding and shaping economic landscapes. .

Guides

Step-by-Step Guide to Economic Modelling: A Comprehensive Approach

# Introduction. Economic modelling plays a crucial role in understanding how economies function. It provides a framework for analyzing various economic scenarios, allowing policymakers, businesses, and researchers to make informed decisions. This guide offers a step-by-step approach to creating effective economic models, suitable for both beginners and seasoned professionals. # Step 1: Define the Objectives of the Model. The first step in economic modelling is to clearly define the objectives of your model. Are you looking to predict economic growth, analyze the impact of policy changes, or evaluate consumer behavior? Defining clear objectives helps you stay focused and tailor your model to meet specific goals. Consider the audience of your model; a model designed for a government agency may differ significantly from one intended for private business concerns. # Step 2: Identify Key Variables and Relationships. Once you understand your objectives, the next step is to identify the key variables that will be included in your model. Variables could include GDP, inflation rates, employment levels, or interest rates. Determine the relationships between these variables—some may be direct (e.g., higher interest rates lead to reduced consumer spending), while others may be indirect or complex. Utilizing existing economic theories can help in establishing these relationships and ensuring that your model is grounded in established principles. # Step 3: Choose the Type of Economic Model. There are various types of economic models to choose from, including structural models, reduced-form models, and econometric models. Structural models are based on economic theories and reflect the underlying processes of the economy. Reduced-form models simplify relationships between variables without describing the underlying processes, while econometric models use statistical methods to analyze economic data. Choosing the right model type depends on the purpose of your analysis and the data available. For example, if you need a detailed understanding of an economy's workings, a structural model might be appropriate. Alternatively, if you require quick predictions based on statistical data, an econometric model could be preferable. # Step 4: Collect and Prepare Data. Data collection is a vital step in the modelling process. Gather data from trusted sources, such as government databases, international organizations, and academic institutions. Ensure your data is up-to-date, relevant, and of high quality. Data preparation involves cleaning the data to eliminate inaccuracies, handling missing values, and structuring it for analysis. The choice of data can significantly impact the model's results. For instance, using outdated data or low-quality sources can lead to misleading conclusions. Take time to verify the credibility of your data sources and ensure they align with your model's objectives. # Step 5: Model Specification and Estimation. In this step, define the mathematical expressions that represent the relationships between your variables. This may involve setting up equations or statistical techniques that will be used in your model. For econometric models, this includes choosing appropriate estimation techniques, such as Ordinary Least Squares (OLS) or Maximum Likelihood Estimation (MLE). Ensure the parameters of your model are properly estimated and tested for significance. Use statistical software tools to aid in computations and visualizations. Proper specification is key, as incorrect relationships can lead to biased results or incorrect assumptions. # Step 6: Validate and Test the Model. Validation is a crucial step in economic modelling. After estimating the model parameters, conduct tests to evaluate its reliability and accuracy. Use techniques such as backtesting or out-of-sample forecasting to measure the model's performance. Assess whether the predicted outcomes closely align with real-world observations. Re-evaluate your model based on validation results. If discrepancies arise, consider revisiting previous steps, such as data collection or variable relationships, to refine your model further. # Step 7: Analyze Results and Draw Conclusions. Once your model is validated, analyze the results to draw meaningful conclusions. Consider the implications of your findings—what do they mean for policymakers, businesses, or researchers? Communicate results clearly, using charts and graphs to enhance understanding. It is essential to remember that no model is perfect. Recognize the limitations of your model and the assumptions made during the process. Prepare to provide recommendations based on model insights, while also considering potential future developments that could affect the economic environment. # Conclusion. Creating an economic model requires careful planning, data collection, and analysis. By following this step-by-step guide, you will be better equipped to construct robust, insightful models that contribute to our understanding of economic dynamics. Whether for research, policymaking, or business strategy, economic modelling serves as an indispensable tool in navigating complex economic landscapes. .

Guides

How to Create Economic Forecasts: A Step-by-Step Guide

# Introduction. Creating economic forecasts is a crucial task for businesses, governments, and investors alike. Accurate predictions can shape business strategies, influence monetary policy, and guide investment decisions. Understanding how to develop these forecasts requires knowledge of various economic indicators, statistical methods, and sometimes even intuition about market trends. This guide will walk you through the essential steps for developing reliable economic forecasts, whether you are a professional economist or an enthusiastic learner. # Understanding Economic Indicators. Before diving into forecasting methods, it’s essential to identify and understand economic indicators. These indicators provide valuable information about the economy's current state and future direction. Common indicators include Gross Domestic Product (GDP), unemployment rates, inflation rates, and consumer confidence indexes. Understanding these indicators allows you to recognize trends and emerging patterns. 1. **Gross Domestic Product (GDP)** - Reflects the value of all goods and services produced in a country. A rising GDP indicates economic growth, while a falling GDP may suggest a recession. 2. **Unemployment Rate** - Measures the percentage of the labor force that is unemployed and actively seeking work. High unemployment rates often correlate with economic downturns. 3. **Inflation Rate** - Indicates the rate at which the general level of prices for goods and services rises, leading to a decrease in purchasing power. It is essential to monitor inflation to maintain economic stability. 4. **Consumer Confidence Index** - Gauges how optimistic or pessimistic consumers are regarding their expected financial situation, revealing trends in consumer spending. By tracking these indicators, you gain insights into economic conditions that can inform your forecasts. # Qualitative vs. Quantitative Forecasting Methods. When creating economic forecasts, you can opt for qualitative or quantitative methods. Both approaches are essential and can complement each other. ### 1. Qualitative Methods. Qualitative forecasting relies on expert judgment and subjective assessments. This method is particularly useful in situations where historical data is scarce or unreliable. Here are some qualitative approaches: - **Focus Groups**: Gather a group of experts to discuss and debate economic trends and potential outcomes. - **Delphi Method**: A structured process of reaching a consensus among a group of experts through multiple rounds of questionnaires. - **Scenario Analysis**: Develop different scenarios based on varying assumptions and analyze how events might unfold under each scenario. ### 2. Quantitative Methods. Quantitative forecasting uses mathematical models and historical data to predict future outcomes. Common quantitative methods include: - **Time Series Analysis**: Analyze historical data to identify patterns and trends, allowing for future predictions. Techniques such as moving averages and exponential smoothing are commonly used. - **Regression Analysis**: Identify relationships between variables to predict future outcomes based on historical patterns. For example, you might find how GDP growth correlates with unemployment rates. - **Econometric Models**: Develop sophisticated statistical models that account for various economic factors to forecast multiple variables simultaneously. Employing both qualitative and quantitative methods provides a comprehensive view and increases the reliability of your forecasts. # Data Collection and Analysis. Collecting accurate and relevant data is the backbone of any economic forecast. Data can come from various sources, including government reports, financial institutions, private sector research, and international organizations. Prioritize gathering reliable data, as poor-quality data can lead to significant forecasting errors. Once the data is collected, it needs to be organized and analyzed. Consider employing data visualization tools to identify trends easily. Use statistical software to perform regression analyses, time series analyses, and other methods that suit your forecasting approach. # Testing and Adjusting Your Forecasts. Creating an economic forecast does not end after the initial analysis. It is crucial to test your forecasts against actual outcomes. Compare your predictions with real-world data as it becomes available, adjusting your models where necessary. Continuous improvement will strengthen your forecasting abilities over time. Consider employing back-testing techniques to refine your methods and increase accuracy. # Conclusion. Creating economic forecasts is a multifaceted endeavor that requires a solid understanding of economic indicators, both qualitative and quantitative forecasting methods, and meticulous data analysis. With practice and experience, your ability to analyze economic conditions and predict future trends will improve. Whether you're in finance, a government agency, or a business setting, mastering economic forecasting will equip you to make informed decisions that lead to success. By following the steps outlined in this guide, you will be well on your way to producing accurate, actionable economic forecasts. Remember, like any skill, forecasting improves with experience, learning from past successes and mistakes. .

Guides

A Beginner’s Guide to Economic Policy: Understanding the Basics

# Introduction. Economic policy is an essential aspect that affects nearly every individual and business within a country. It encompasses a wide range of topics, from taxation to government spending, monetary policy, and regulation. As we navigate our modern world, understanding economic policy is crucial for making informed decisions and contributing to discussions about the economic direction of our communities and nations. This guide will pave the way for beginners seeking a solid foundation in economic policy, explaining key concepts and their implications thoroughly. # What is Economic Policy?. At its core, economic policy refers to the actions taken by a government to manage its economy. This includes setting policy goals related to growth, inflation, employment, and the balance of trade. Economic policies are often classified into two main categories: **Fiscal Policy** and **Monetary Policy**. Fiscal policy involves the use of government spending and taxation to influence economic activity, while monetary policy relates to the actions of a nation’s central bank concerning the money supply and interest rates. Both are fundamental tools used to target economic outcomes. # Types of Economic Policies.. ## Fiscal Policy. Fiscal policy is one of the primary tools that governments use to influence their economies. It includes decisions related to taxation and government expenditure. When a government increases spending, it can stimulate economic growth by creating jobs and increasing demand for goods and services. Conversely, raising taxes can help slow an overheated economy but might also decrease consumer spending, leading to slower growth. A balance must be struck to achieve desired economic goals. ## Monetary Policy. On the other hand, monetary policy is managed by a country’s central bank and focuses on controlling the money supply and interest rates. Lower interest rates typically encourage borrowing and investing, fueling economic growth, while higher rates can rein in inflation. Central banks may adjust the money supply to respond to changes in the economy's performance, thus helping to stabilize prices and control inflation. # The Role of Economic Indicators.. Understanding economic indicators is vital for analyzing the effectiveness of economic policies. Indicators like Gross Domestic Product (GDP), unemployment rates, inflation rates, and consumer confidence can provide insights into how well the economy is performing. **GDP** measures the total economic output, while the unemployment rate indicates the percentage of the workforce that is jobless and actively seeking employment. **Inflation**, measured through the Consumer Price Index (CPI), shows how prices for goods and services rise over time. Tracking these indicators helps policymakers adjust their strategies to maintain economic stability. # The Impact of Economic Policy on Society.. Economic policy has a profound impact on people's lives. For instance, policies aimed at reducing income inequality can create programs that support education and job training, benefitting lower-income individuals. However, poorly designed policies can lead to adverse outcomes, such as prolonged job losses or wealth concentration among the wealthy. Additionally, the public's perception of economic policy effectiveness can shape political discourse and electoral outcomes, making it crucial for citizens to stay informed. # How to Get Involved and Stay Informed.. For those looking to impact economic policy, education is key. Begin by understanding the fundamental aspects discussed here and consider pursuing courses in economics or public policy. Additionally, engage with community programs, attend town hall meetings, and read reputable news sources to stay abreast of current policy discussions. Joining advocacy groups or nonprofit organizations focused on economic issues can also provide a platform for your voice to be heard, helping to influence the economic landscape. # Conclusion. Understanding economic policy is an invaluable skill that empowers individuals to participate actively in discussions that shape our world. As beginners, take the time to grasp the intricacies of fiscal and monetary policy, recognize the importance of economic indicators, and appreciate the profound effects that economic decisions have on society. Engage in lifelong learning and community interaction to ensure that your voice contributes to effective policy-making, fostering a healthy economy for all. .

Latest on all blogs

-
-

00:02

Discovering Hidden Gems: Unveiling Travel Itineraries with Unique Experiences.

Introduction. Traveling is all about discovering new places and experiencing them in unique ways. Destinations often touted as 'must-visits' can become crowded and commercialized, which can detract from the original charm.
Image Description

23:02

The Role of Think Tanks in Economics: Shaping Policies and Perspectives.

The Role of Think Tanks in Economics: Shaping Policies and Perspectives. Introduction. In an era where economic challenges are ever-evolving, the role of think tanks has become increasingly significant.
Image Description

20:00

Illuminate Your Space: The Ultimate Guide to Interior Lighting.

Illuminate Your Space: The Ultimate Guide to Interior Lighting. Introduction. Lighting is a crucial aspect of interior design that can transform any space, affecting not only the aesthetics but also the functionality of a room.
Image Description

Ads

-
-

Our office

-
-
Articles in category business
Home Latest Radio Partners